


Preview
Abstract
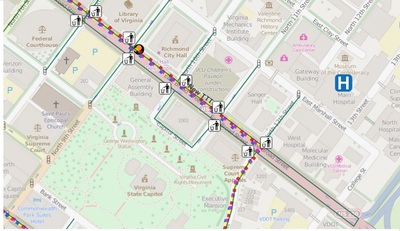
ArcGIS MAP Image 1 : The pictured image displays data sets regarding established fan zones, street closures, the location of Eco-stations and emergency service, as well as the cyclist’s course specific to the day’s event.
Course
Adaptive Response Modeling Using GIS (UNIV 291 Sec 040)
Publication Date
September 2015
Document Type
Image
Date of Submission
November 2016
Journal/Book/Conference
Great VCU Bike Race Book
Rights
This work is licensed under a Creative Commons Attribution-NonCommercial-ShareAlike 4.0 International (CC BY-SA 4.0) License.
Is Part Of
Great VCU Bike Race Student Images
COinS