


Preview
Description
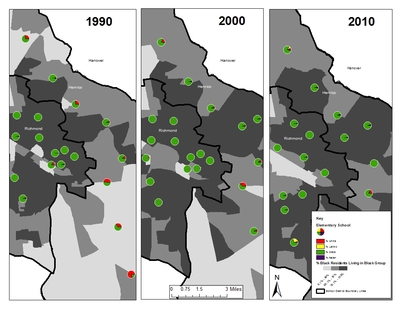
Map 10 illustrates the process of racial change and increasing segregation in an inner- ring suburban area just across Richmond’s northeastern border. In 1990, two small sections of central Henrico were less than 30 percent black, holdovers from a not-so-distant era when white residents accounted for more than 90 percent of the suburb’s population. More predominant, however, were diverse neighborhoods in which black residents made up between 30 and 70 percent of the population. At the same time, black residents accounted for the overwhelming share of residents in a handful of central Henrico neighborhoods, particularly those closest to the city-suburban line, almost mirroring patterns found in the city of Richmond. And in conjunction with those neighborhood trends, in 1990 elementary schools serving this portion of Henrico County enrolled large majorities of black students, though several still reported sizable shares of white students.
A decade later, in 2000, larger portions of central Henrico were characterized by growing black isolation. Elementary schools in the area reflected these shifts, nearly all of which were intensely segregated by this point.
By 2010, black population the movement of blacks across Richmond and Henrico’s school district boundary line meant that serious resegregation had taken root in the central portion of the suburb. Black students constituted nearly 100 percent of the student population in central Henrico’s elementary schools, almost certainly foreshadowing further neighborhood transition to come. Map 10 also shows that Latino students, for the first time, accounted for a small share of students in central Henrico—indicative of future patterns of black-Latino segregation. In another ten years, unless active steps are taken to provide black suburban students and residents with greater access to other parts of Henrico, large swaths of the county may look like a lot like the city’s historically segregated neighborhoods.
Conversely, in some limited places Richmond is beginning to resemble the Henrico County of yesteryear. A growing portion of downtown and eastern neighborhoods reported majority white populations in 2010. That shift likely reflects the leading edge of Richmond’s first white population increase in decades, a trend that has intensified since the close of this study. When it comes to schools in and around those gentrifying city neighborhoods, however, little easing of extreme minority segregation is apparent—to date.
The Richmond area showcases how significant demographic changes play out in a fragmented context that has chosen to ignore school (and neighborhood) segregation for nearly three decades. While the fragmentation of Richmond differs from the other three city-suburban school systems, it is emblematic of many other parts of the country. Rapid growth and demographic change in most metropolitan communities has largely occurred largely without accompanying policies seeking to harness the potential of those transformations. Instead, in many ways, law and policy have cemented tremendous inequities into metropolitan spaces.
Source: U.S. Census, 2014, TigerLine Shapefiles.
Creation Date
2016
Is Part Of
VCU Mapping Files to Accompany When the Fences Come Down: Twenty-First-Century Lessons from Metropolitan School Desegregation
Rights
Creative Commons Attribution-NonCommercial-ShareAlike 4.0 International License
Date of Submission
March 2016