


Preview
Description
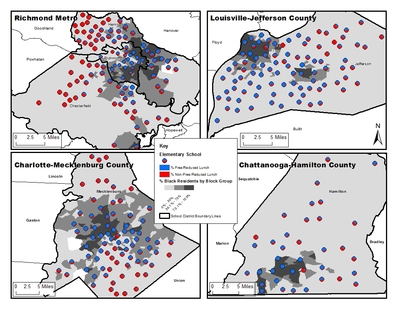
In 2009, it is important to note that intense racial segregation was also linked to elementary schools with high concentrations of student poverty. Map 9 shows that nearly all schools in segregated black neighborhoods contained a majority of students qualifying for free or reduced-priced lunches. Conversely, predominantly nonblack neighborhoods reported schools with much higher shares of students who did not qualify for free or reduced price lunches. These broad trends, which persisted even in Louisville, the only metro with an ongoing, wide-ranging school desegregation plan in 2009, could reflect the historic emphasis on integrating students by race, but not necessarily by class. Louisville-Jefferson County’s new, multicriteria student assignment plan—which considers socioeconomic status alongside race—may produce a different set of patterns if it is fully implemented in coming years.
Source: NCES Common Core of Data, 1992–93, 1999–2000, and 2009–10.
Creation Date
2016
Is Part Of
VCU Mapping Files to Accompany When the Fences Come Down: Twenty-First-Century Lessons from Metropolitan School Desegregation
Rights
Creative Commons Attribution-NonCommercial-ShareAlike 4.0 International License
Date of Submission
March 2016