


Files
Download Full Text (1.4 MB)
Abstract
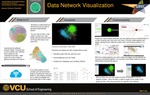
Data visualization is an essential component of any data analysis. A visual image can aid in more in-depth analysis of any researched data. Although there are data visualization products that already exist on the market, such as Gephi, yEd Graph editor, and OmniGraffle, they are platform-dependent and can be difficult for novice users to install and get started. Data Network Visualization eliminates these weaknesses by being fully accessible through the web, while having a less cluttered user interface. This allows a user to take advantage of a variety of visualization tools without the need to download a program.
To achieve the goals of the project, the application would need to be able to visualize graph data given by the user. A user can then alter the graph generated to match their needs, then save it and open the graph at a later date. A major constraint has been making sure the data visualization functionality was as robust, editable, and feature-rich as possible in the amount of time given to work on the project. The project team divided the work based on individual strengths, while aiding others who were in need of help through communication on social media. Front end functionality of the website has been mostly completed with a few bugs, however, the back end server requires work in saving and opening graph files for users. Data Network Visualization will allow researchers to better understand their collected data, specifically analyzing trends and relationships.
Publication Date
2016
Keywords
Computer engineering, data, network visualization, online editor, cloud computing
Disciplines
Computer Engineering | Engineering
Faculty Advisor/Mentor
Robert Dahlberg
Faculty Advisor/Mentor
Thang Dinh
VCU Capstone Design Expo Posters
Rights
© The Author(s)
Date of Submission
August 2016